
Select Language
ICAR
All India Coordinated Research Project on Goat Improvement

CIRG

Jamunapari Unit, CIRG, Makhdoom, Farah, Mathura, Uttar Pradesh

Principal Investigator

  • Dr. P. K. Rout, Principal Scientist (AG&B)

Activity assigned and targets fixed for each activity during the period

The Unit has been based on close farm based goat population being maintained in semi-intensive system of management. Following targets are laid down for this Unit.

  • In XII plan the unit has to work with KVK’s in the district of Etawah the home tract of the breed and another KVK where strain of this breed is available in sizeable number for technology validation, impact evaluation, grading up and brining genetic improvement in farmers flock. Necessary fund required for this purpose can be utilized from allocated fund to this Unit.
  • To adopt farmers either through KVK’s or directly for technology validation.
  • Distribute approximately 15-20 bucks to farmers flock for breeding purpose in adopted area under this project on the line of field unit.
  • Necessary health care to goats in adopted farmers will be provided under the project.

Activity carried out during the period

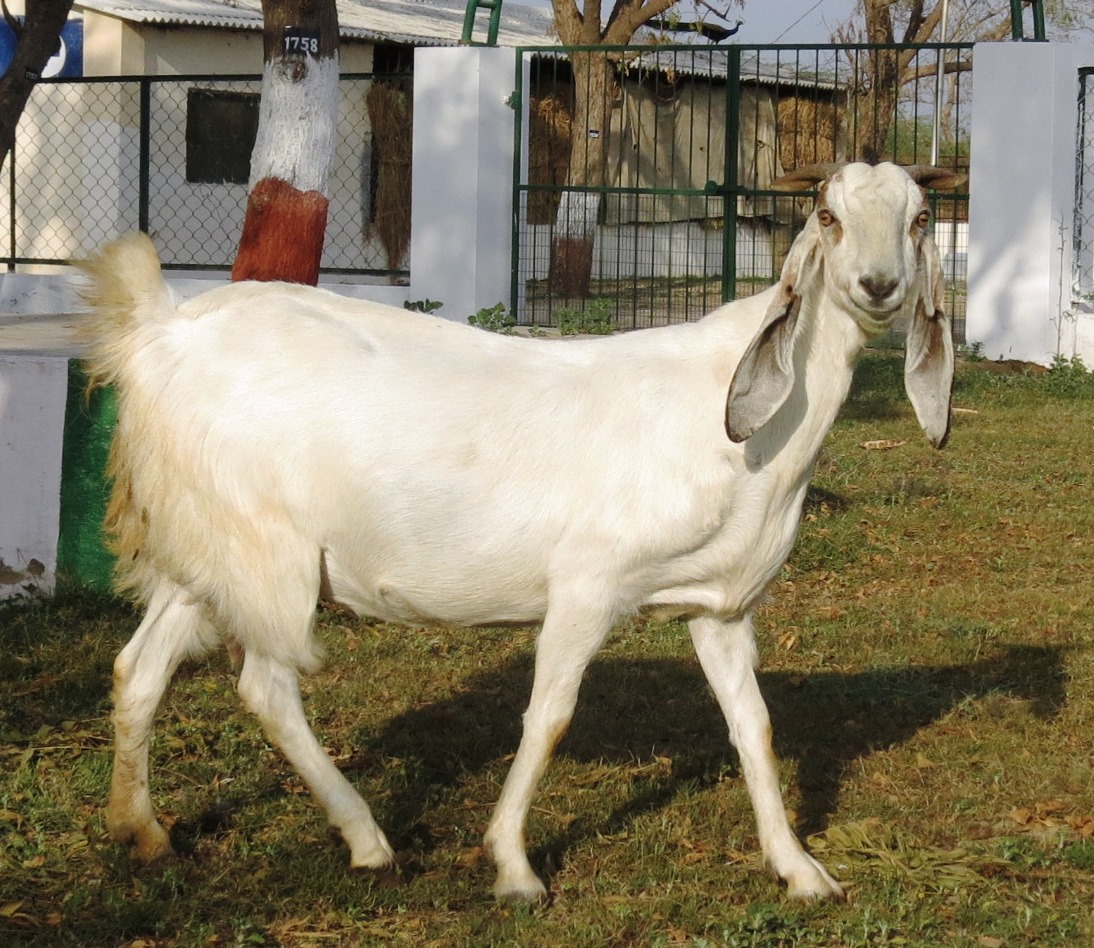
The Farm Unit has been maintaining approximately 300 adult breedable does along with its followers. Presently the goats are undergoing 15-17 generations of intense selection for body weight growth, milk production and fecundity. The data on body weight growth, milk production, reproduction, health aspects are generated. The controlled breeding is followed in two breeding seasons during April-June and September-November. Data are then subjected to genetic evaluations using appropriate statistical models. The bucks selected are used at the farm and spared to agencies and farmers for breed improvement purpose.

Detailed Achievements

Flock Statistics

Opening balance of the flock was 758 and closing balance was 739. The opening balance of breeding females was 739 and closing balance was 741 (Table 1)..The population growth of the flocks was 101.0% and mortality rate was 6.67%. The kidding rate was 1.46% during the period under report. Two hundred thirteen (213) genetically superior, does and bucks each, were sold for grading up, conservation and genetic improvement of farmers flock during the year 2013-14.
Table 1:  Flock Strength of Jamunapari goat (2012–13)

Age group

Opening Balance
(1/4/2013)

Closing Balance
(31/3/2014)

Male

0-1 M

24

32

1-3 M

52

79

3-6 M

79

68

6-12 M

06

04

12-18 M

30

08

Adult

18

20

Total

209

211

Female

0-1 M

21

32

1-3 M

34

80

3-6 M

75

63

6-12 M

03

09

12-18 M

110

46

Adult

287

300

Total

530

530

G. Total

739

741

Body Weight

The least squares means of body weights of kids at birth, 3, 6, 9 and 12 months of age during the year 2012-13 were 3.41, 12.11, 15.10, 19.50 and 26.48 kg, respectively (Table 2.2). Parity of dam had significant on kid’s body weight up to 6 months of age. Male kids maintained higher weights at all growth stages over their counterpart. Kids born as single also showed significantly higher weights than those born as twins or triplets. The Average Daily Weight Gain (ADG) of the kids under intensive management were 73.89, 120.78, 111.89 and 102.18 g/day, respectively during 3-6, 6-9, 9-12 and 3-12 month age group. The mean of body weights of kids at birth, 3, 6, 9 and 12 months of age over the year were 3.4, 12.11, 15.10, 19.50 and 26.48 kg, respectively. 

Table 2:  Least Square Mean of Body Weight Growth (Kg) in Jamunapari Goats

Year

Weight at

Birth

3M

6 M

9 M

12 M

2011

3.17±0.04  (466)

10.92±0.13
(448)

14.99±0.22    (428)

19.41±0.28    (401)

23.37±0.36
(348)

2012

3.17±0.04
(346)

09.63±0.14
(333)

14.55±0.26
(181)

18.65±0.38
(131)

22.91±0.48
(118)

2013

3.41

12.11

15.10

19.50

26.48

Milk Production

Milk production data of 2217 Jamunapari goat during the period 1995 to 2012 was analysed.  The mean of 90 days, 140 days and lactation milk yield of the Jamunapari goat over the 17 years was 80.18, 113.98 and 124.82 litre, respectively. The average lactation yield was 124.82 litres with a lactation length of 179.5 days. Means, standard deviations, and coefficients of variation are also shown in the table 3.
Table 3:  Data structure and means, standard deviations and standard errors for milk yield and lactation length traits

Factor

90 days MY

140 days MY

Lactation MY

Lactation Length

 Number of Records

2217

1788

2099

2099

Number of does

2217

1788

2099

2099

Number of years

17

17

17

17

Mean

80.18 litre

113.98 litre

124.82 litre

179.5 days

SD

33.3

38.1

51.06

42.17

Standard error

0.708

0.90

1.11

0.92

CV

41.6

33.48

40.90

23.49

Range/ Maximum

21.8-168.0

46.8-233.6

33.0-273.7

70-277

The log-likelihood obtained for each trait in four different models was compared (Table 5). The most appropriate model for milk yield at 90, 140 and lactation yield was animal and maternal effect.  The appropriate model for lactation length was direct (animal + PE) effect. Parameter estimates fitting the most appropriate model for milk yield and lactation length was presented in Table 2. The estimates of direct heritability for MY90, 140 MY, LMY and LL were 0.577, 0.765, 0.781 and 0.148, respectively. The maternal variance and variance due to permanent environment were very low for all the traits under study. The maternal permanent environmental component due to dam and litter contributed negligibly. The heritability  estimates across different traits with  small standard errors  (varies from  0.015 to 0.036)  resulted from the large size of the data and the precise estimate  showed the genetic improvement for milk production for 90 days and 140 days period will be successful by selection.

Components

MY90

MY140

LMY

LL

Anim

Maternal

Anim

Maternal

Anim

Maternal

Anim

PE

var direct

55329.2

54825.8

98190.3

95471.2

149108

138727

267.162

217.488

var-maternl


723.148


3137.35


11358


Var-pe


88.1905

var-res

39473.2

39422.3

26223.3

26148.4

27505.6

27358.8

1181.9

1158.29

pheno

94802

94971

1.24E+05

1.25E+05

1.77E+05

1.77E+05

1.45E+03

1.46E+03

se

4404.4

4427.8

6629

6649.9

8959.8

9016.6

50.329

51.913

h2

0.5836

0.5773

0.7892

0.7653

0.8443

0.7818

0.1844

0.1486

se

0.0267

0.0367

0.0152

0.0351

0.0106

0.035

0.0312

0.033

mat2


0.0076


0.0251


0.064


se


0.0282


0.0329


0.0346


Log L

-3242.6

-3242.59

-10580.7

-10580.4

-2573.18

-2571.15

-8557.1

-8553.05

                    Table 3:  Model effect and genetic parameter

Reproduction

Reproductive performance of Jamunapari goats in terms of breeding efficiency and kidding percent on the basis of does tupped were 86.03% and 121.10%, respectively.  The kidding rate was 1.46 (Table 5). During this year, a total of 254 does kidded 373 kids, out of which single, twin and triplet born kids were 138, 113 and 3, respectively.
Table 5: Reproduction performance of Jamunapari goats

Sl.
No.

Particulars

2011-12

2012-13

2013-14

1.

No. of  available does for breeding (X)

362

377

422

2.

No. of  does  bred (Y)

322

349

365

3.

Tupping %  (Yx100)/X)

88.95

92.57

86.49

4.

Does kidded

268

254

254


Single   (C)

172

177

138


Twin     (D)

90

73

113


Triplet  (E)

06

04

03

5.

Actual live  birth  (I)

370

335

373

6.

Breeding efficiency / fertility
(a ) On the basis of does available 

83.33

84.85

72.60


(b) On the basis of does tupped    

90.45

94.59

86.03

7.

Kidding (%)
(a) On the basis of does available                                                                                      

116.06

110.12

102.19


(b) On the basis of does  tupped

125.08

125.00

121.10

8.

Kidding rate (litter size)

1.40

1.38

1.46

Genetic parameters

Genetic parameters for body weights at various stages of growth and milk production traits were estimated. The heritability estimates for body weights at birth, 3, 6, 9 and 12 month age were 0.146±0.073, 0.743±0.157, 0.656±0147, 0.512±0.129 and 0.293±0.097, respectively. The heritability estimates for 90 day and 140 day milk yield were 0.390±0.112 and 0.343± 0.114, respectively (Table 6).
Table 6: Heritability estimates for milk production and growth traits

Traits

Estimates

Birth weight

0.146±0.073

3 month weight

0.743±0.157

6 month weight

0.656±0147

9 month weight

0.512±0.129

12 month weight

0.293±0.097

90 day milk yield

0.390±0.112

140 day milk yield

0.343± 0.114

Supply of elite Germplasm

Elite breeding bucks were supplied to various organization and goat breeding for improvement in productivity (Table 7). During the year 2013-2014, 213 superior germplasm (117 bucks and 96 does) were provided to breeders for breed improvement.

Table 7: Germplasm supplied for breed improvement during last 4 years

Year

Male

Female

Total

2010-11

65

34

99

2011-12

121

91

212

2012-13

119

61

180

2013-14

117

96

213


Revenue generation

The revenue generated source and total revenue generated for the flock during the year 2013-14 was more than Rs. 11.93 Lakhs through sale of milk, culled animals, bucks/does, skin and manure etc.

Gaps/constraints/shortfalls / excess and reasons thereof,  if any

The Unit has taken steps to adopt farmers of the field. However greater emphasis is to be given in field performance recording and impact of technology validation. The staff required is not as per approval. The fund utilization was 19.9 % on the basis of BE and 78.3 % on the basis of RE revised.

PC’s evaluation: Very Good (A); Good (B); poor (C)

------------------Good (B) -----------------

Future programme identifying the activities, timeline and targets for each of the activity

     The Unit has been based on close farm based goat population being maintained in semi-intensive system of management. As per technical programme of the Unit approved under XII Plan

Remarks

The Unit has performed satisfactorily. Superior goats have been spared by the Unit to various agencies for breed improvement.